
Highlight 14/2026: Europe’s Energy Strategy After Ukraine: Lessons from the Iran–Hormuz Crisis
Kevin Villacis, 28 April 2026
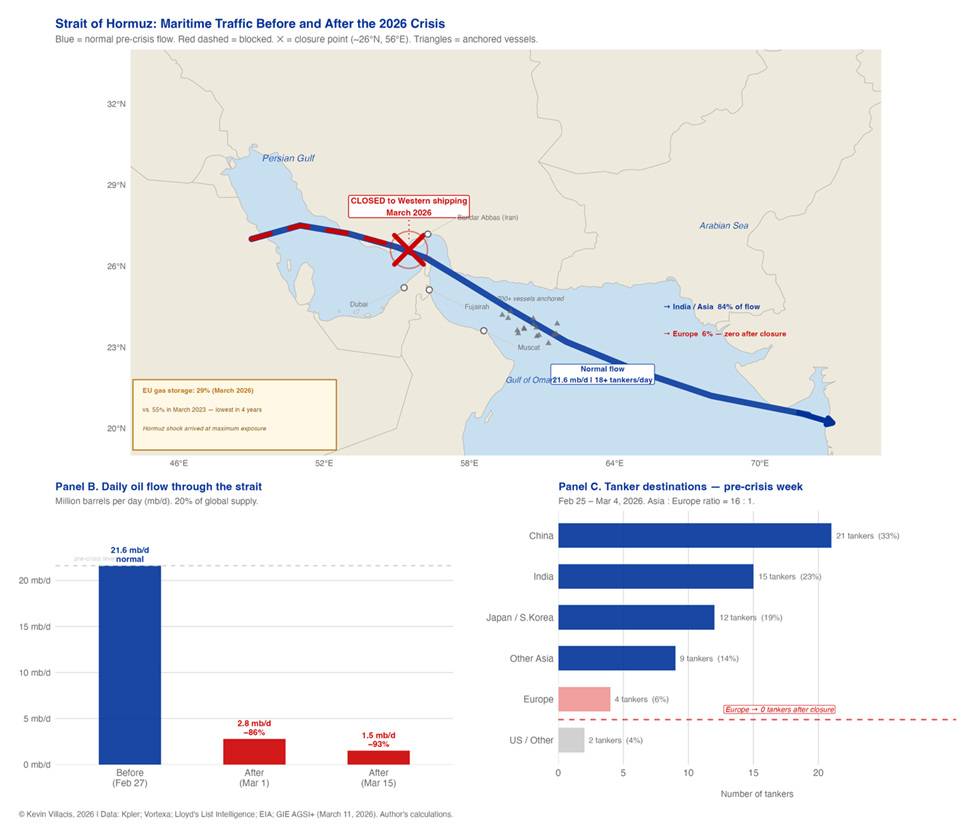
The closure of the Strait of Hormuz in early March 2026 revealed a vulnerability Europe believed it had already solved. Following a joint U.S.–Israeli strike on Iranian nuclear facilities on February 28, Iran’s Revolutionary Guard declared effective control of the strait. Oil traffic collapsed almost immediately. As shown in the graphic below, daily flows fell from roughly 21.6 million barrels per day to fewer than 3 million within days, leaving hundreds of vessels anchored in the Gulf of Oman and halting Western-bound shipments.
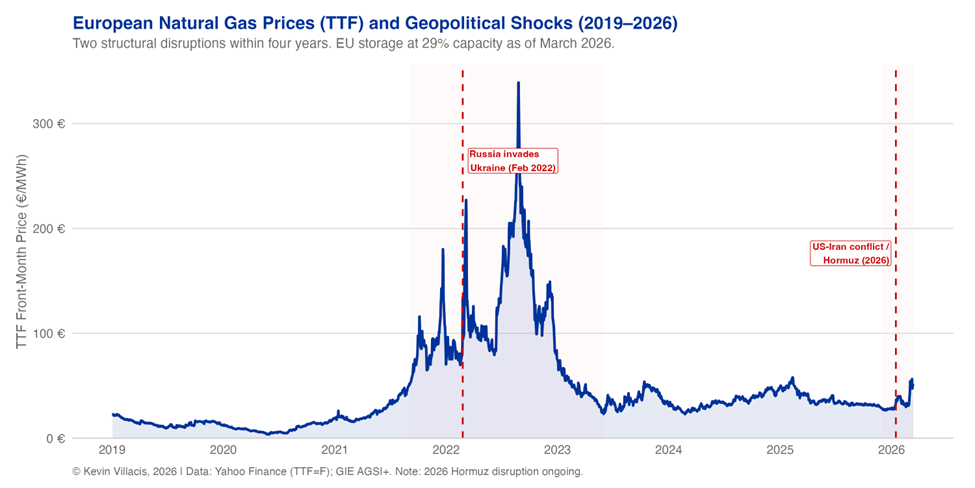
The price response was immediate but familiar. The next chart places the shock in historical perspective by tracing European natural gas prices since 2019. The Russian invasion of Ukraine in 2022 produced the first major disruption, sending TTF prices to nearly €340/MWh. The Hormuz crisis represents the second major geopolitical shock to European energy markets in less than four years. While prices have not yet reached the extremes observed in 2022, the structural context is less favourable: EU gas storage stood at roughly 29% of capacity in March 2026, well below the levels observed in early 2023.
The deeper issue is structural rather than temporary. After 2022, Europe rapidly replaced Russian pipeline gas with liquefied natural gas imports from suppliers such as Qatar, the United States, and Norway. The shift reduced dependence on Russia but did not necessarily reduce dependence on external supply chains. Much of the LNG that replaced Russian gas originates in Qatar, whose export terminals lie inside the Persian Gulf. Every shipment destined for Europe must therefore pass through the Strait of Hormuz.
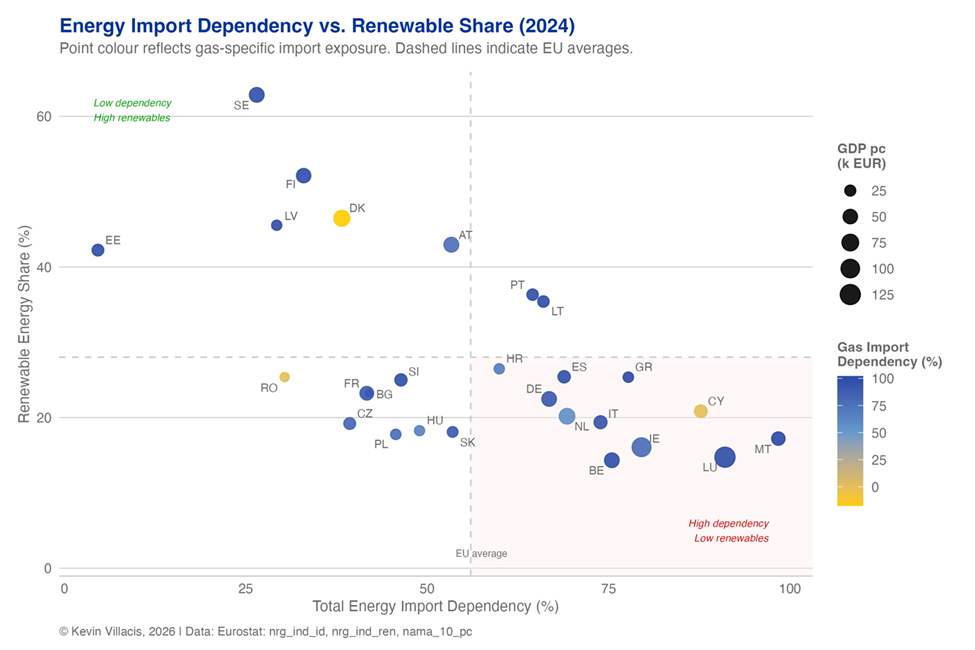
The broader structure of Europe’s energy system helps explain why this matters. The scatter plot below compares energy import dependency with renewable energy shares across EU member states. Most countries remain clustered in the quadrant combining high import dependence with relatively modest renewable penetration. A few cases (such as Sweden and Estonia) display the opposite pattern, but they remain exceptions rather than the rule.
This structural heterogeneity becomes clearer when mapped across the continent. The map below presents a composite Hormuz vulnerability index combining gas import exposure, storage deficits, and renewable capacity. Several of the EU’s largest economies, including Germany, France, Belgium, and the Netherlands, emerge among the most exposed. By contrast, countries with stronger renewable deployment or lower import dependence, such as Portugal and Denmark, appear significantly less vulnerable.
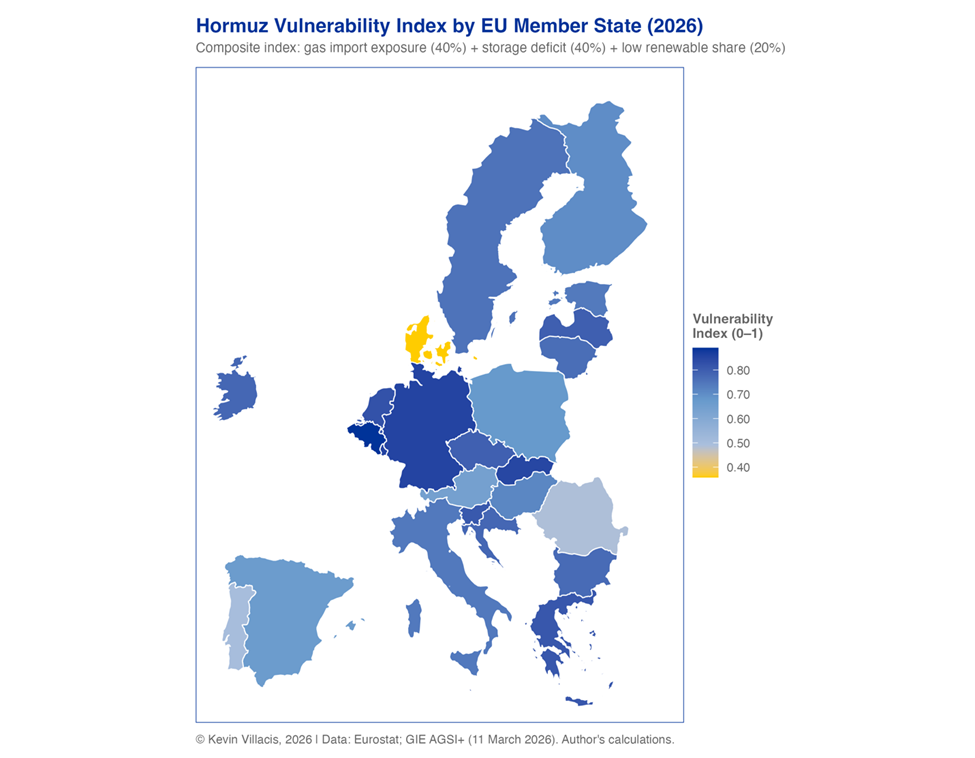
Kevin Villacis, 2026 | Data: Eurostat; GIE AGSI+ (March 11, 2026). Author’s calculations.
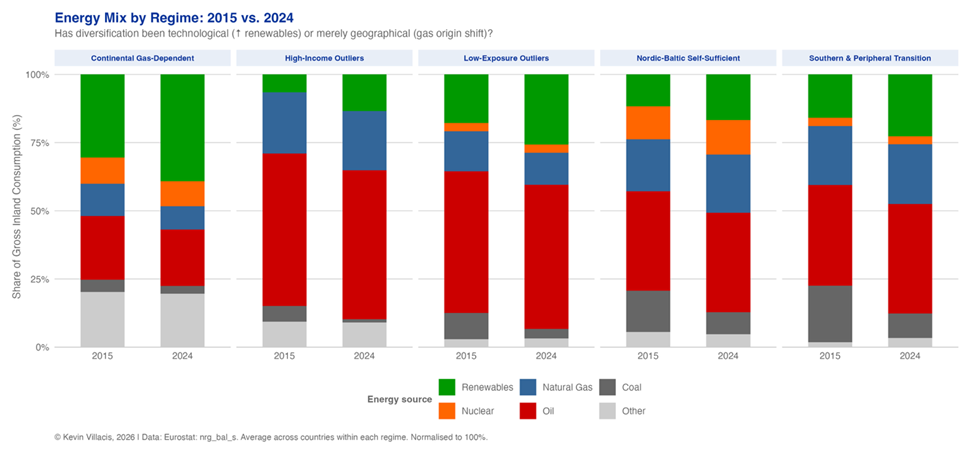
The persistence of this vulnerability reflects the nature of Europe’s energy transition over the past decade. As shown in the chart below, renewable energy shares increased across all country groups between 2015 and 2024. Yet the expansion was not large enough to fundamentally alter the continent’s reliance on imported fossil fuels. Coal declined, but oil and gas remained dominant across most regimes.
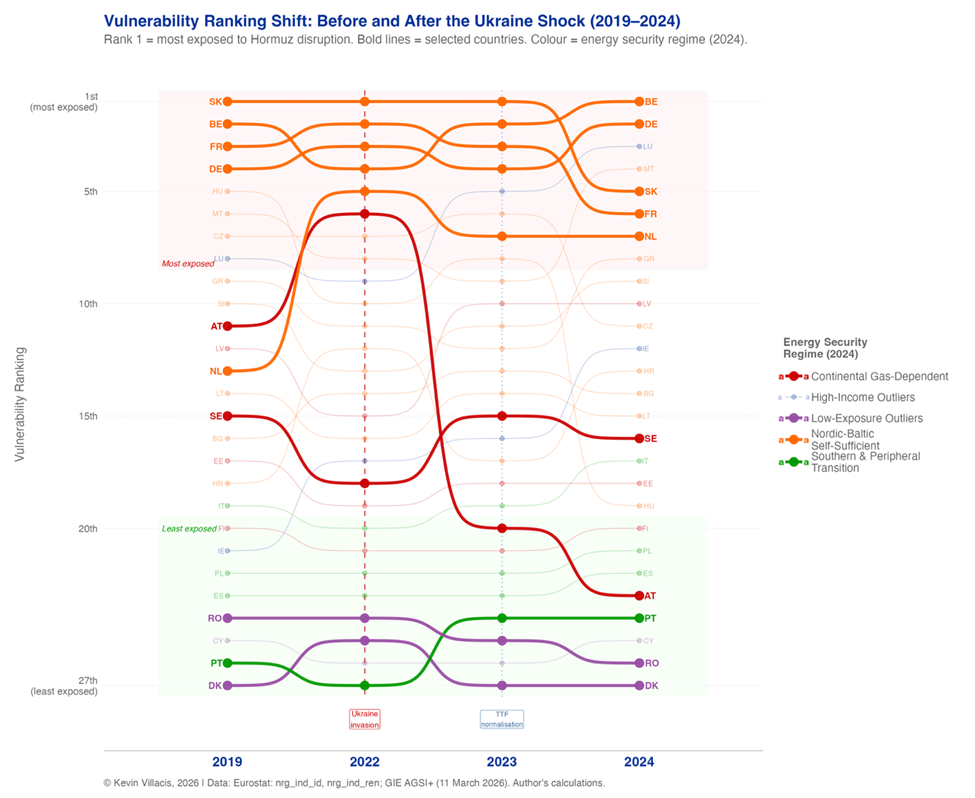
This helps explain the final pattern visible in the last figure, which tracks vulnerability rankings before and after the Ukraine crisis. While some countries temporarily improved their position as prices stabilised in 2023, the overall structure of exposure changed little. The apparent stabilisation of European energy markets between 2023 and 2025 therefore reflected market adjustment rather than structural transformation.
European initiatives such as REPowerEU and the European Hydrogen Bank signal genuine political ambition to accelerate the energy transition. Yet the evidence presented here suggests that structural change in energy systems occurs far more slowly than policy declarations. The Hormuz crisis did not create Europe’s energy vulnerability. It simply revealed that the diversification achieved after 2022 was largely geographic rather than structural. Replacing one supplier with another may reduce immediate risks, but genuine energy security will likely require reducing reliance on imported fossil fuels altogether.
This highlight has also been published on the blog of the author.
Kevin Villacis, Highlight 14/2026: Europe’s Energy Strategy After Ukraine: Lessons from the Iran–Hormuz Crisis, 28 April 2026, available at www.meig.ch
The views expressed in the MEIG Highlights are personal to the authors and neither reflect the positions of the MEIG Programme nor those of the University of Geneva